wolfhece.report.compare_cs_dem
Module Contents
- class wolfhece.report.compare_cs_dem.CSvsDEM_MainLayout(title: str, filename='', ox=0, oy=0, tx=0, ty=0, parent=None, is2D=True, idx='', plotted=True, mapviewer=None, need_for_wx=False, bbox=None, find_minmax=True, shared=False, colors=None)[source]
Bases:
wolfhece.report.common.DefaultLayoutA4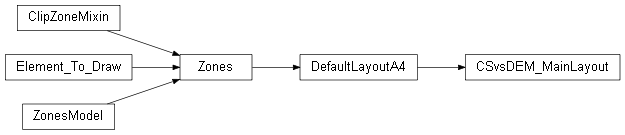
Layout for comparing cross-sections, array and Lidar LAZ in a report.
1 cadre pour la zone traitée avec photo de fond ign + contour vectoriel 1 cadre avec zoom plus large min 250m 1 cadre avec matrice ref + contour vectoriel 1 cadre avec matrice à comparer + contour vectoriel 1 cadre avec différence 1 cadre avec valeurs de synthèse
1 cadre avec histogramme 1 cadre avec histogramme des différences
- class wolfhece.report.compare_cs_dem.CSvsDEM_IndividualLayout(title: str, filename='', ox=0, oy=0, tx=0, ty=0, parent=None, is2D=True, idx='', plotted=True, mapviewer=None, need_for_wx=False, bbox=None, find_minmax=True, shared=False, colors=None)[source]
Bases:
wolfhece.report.common.DefaultLayoutA4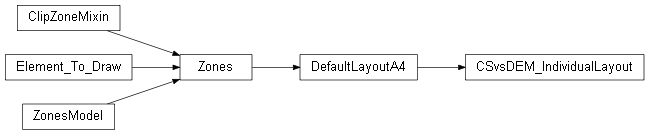
Global layout for A4 report.
This class inherits from Zones and defines a standard layout for A4 reports. It includes predefined areas for the title, versions, logo, and footer.
- class wolfhece.report.compare_cs_dem.CSvsDEM(data_group: list, idx: int, dem: wolfhece.wolf_array.WolfArray, title: str = '', index_group: int = 0, index_cs: int = 0, rebinned_dem: wolfhece.wolf_array.WolfArray = None)[source]
Class to manage the difference between a unique cross-section and a DEM.
- property differences: tuple[float, float][source]
Get the difference between the cross-section and the DEM at extremities.
- set_palette_distribute(minval: float, maxval: float, step: int = 0)[source]
Set the palette for both arrays.
- set_palette(values: list[float], colors: list[tuple[int, int, int]])[source]
Set the palette for both arrays based on specific values.
- plot_position_grey(figax: tuple[matplotlib.pyplot.Figure, matplotlib.pyplot.Axes] = None, size_around: float = 250) tuple[matplotlib.pyplot.Figure, matplotlib.pyplot.Axes][source]
Plot the reference array with a background.
- plot_position(figax: tuple[matplotlib.pyplot.Figure, matplotlib.pyplot.Axes] = None, width: int = 3, color: int = 16711680) tuple[matplotlib.pyplot.Figure, matplotlib.pyplot.Axes][source]
Plot the dem array.
- plot_position_around(figax: tuple[matplotlib.pyplot.Figure, matplotlib.pyplot.Axes] = None, size_around: float = 50.0, width: int = 3, color: int = 16711680, s_extremities: int = 50, colors_extremities: tuple[str, str] = ('blue', 'green')) tuple[matplotlib.pyplot.Figure, matplotlib.pyplot.Axes][source]
Plot the dem array.
- plot_cs_in_group(figax: tuple[matplotlib.pyplot.Figure, matplotlib.pyplot.Axes] = None, width: int = 2, color: int = 255) tuple[matplotlib.pyplot.Figure, matplotlib.pyplot.Axes][source]
Plot the others cross-sections in the group if exists.
- plot_dem_around(figax: tuple[matplotlib.pyplot.Figure, matplotlib.pyplot.Axes] = None, size_around: float = 10.0, width: int = 3, color: int = 16711680, s_extremities: int = 50, colors_extremities: tuple[str, str] = ('blue', 'green')) tuple[matplotlib.pyplot.Figure, matplotlib.pyplot.Axes][source]
Plot the dem array.
- plot_position_scaled(scale=4, figax: tuple[matplotlib.pyplot.Figure, matplotlib.pyplot.Axes] = None, width: int = 3, color: int = 16711680) tuple[matplotlib.pyplot.Figure, matplotlib.pyplot.Axes][source]
Plot the reference array.
- Parameters:
scale – Scale factor to apply to the extent of the DEM. For example, scale=1 will double the extent, scale=2 will triple it, etc.
figax – Tuple of (Figure, Axes) to plot on. If None, a new figure and axes will be created.
- plot_dem(figax: tuple[matplotlib.pyplot.Figure, matplotlib.pyplot.Axes] = None) tuple[matplotlib.pyplot.Figure, matplotlib.pyplot.Axes][source]
Plot the reference array.
- plot_cs(figax: tuple[matplotlib.pyplot.Figure, matplotlib.pyplot.Axes] = None) tuple[matplotlib.pyplot.Figure, matplotlib.pyplot.Axes][source]
Plot the cross section to compare.
- plot_cs_min_at_x0(figax: tuple[matplotlib.pyplot.Figure, matplotlib.pyplot.Axes] = None) tuple[matplotlib.pyplot.Figure, matplotlib.pyplot.Axes][source]
Plot the cross section to compare.
- plot_cs_limited(figax: tuple[matplotlib.pyplot.Figure, matplotlib.pyplot.Axes] = None, tolerance: float = 1.0) tuple[matplotlib.pyplot.Figure, matplotlib.pyplot.Axes][source]
Plot the cross section to compare.
- plot_up_down_min_at_x0(figax: tuple[matplotlib.pyplot.Figure, matplotlib.pyplot.Axes] = None, n_iter=2) tuple[matplotlib.pyplot.Figure, matplotlib.pyplot.Axes][source]
Plot the cross section to compare.
- _complete_report(page: CSvsDEM_IndividualLayout)[source]
Complete the report with the arrays and histograms.
- class wolfhece.report.compare_cs_dem.CompareMultipleCSvsDEM(cross_sections: wolfhece.PyCrosssections.crosssections | pathlib.Path | str, dem: wolfhece.wolf_array.WolfArray | str | pathlib.Path, laz_directory: pathlib.Path | str = None, support: pathlib.Path | str | wolfhece.PyVertexvectors.vector = None, threshold_z: float = 0.5, distance_threshold: float = 50.0)[source]
-
- _groups: list[list[dict['section_id':int, 'x':float, 'y':float, 'diff_left':float, 'diff_right':float, 's':float]]][source]
- find_differences(tolerance: float = 0.5, distance_threshold: float = 50.0)[source]
Find differences between cross-sections and DEM.
Store the differences in self._diffs as a list of lists of dictionaries with keys: section_id, x, y, diff_left, diff_right.
We need to group the closest cross-sections that have differences. So, we start from the upstream cross-section and go downstream, grouping cross-sections which have differences and are close to each other (less than distance_threshold m apart).
- Parameters:
tolerance – Tolerance in meters to consider a difference. If the absolute difference between the cross-section and the DEM is greater than this value, it is considered a difference.
- count_groups_greater_than(threshold: int) int[source]
How many groups of differences are greater than a given threshold?
- _diff_to_dataframe()[source]
Compile dict in list of lists to a single pandas DataFrame.
Dataframe columns: x, y, diff Dataframe index: profile
- property _all_left_differences_as_np: numpy.ndarray[source]
Get all left differences as a single array.
- property _all_right_differences_as_np: numpy.ndarray[source]
Get all right differences as a single array.
- plot_histogram_differences(figax: tuple[matplotlib.pyplot.Figure, matplotlib.pyplot.Axes] = None, density=True, alpha=0.3, **kwargs) tuple[matplotlib.pyplot.Figure, matplotlib.pyplot.Axes][source]
Plot histogram of all differences.
- _read_differences_json(differences: pathlib.Path | str) list[list[dict['section_id':int, 'x':float, 'y':float, 'diff':float]]][source]
Differences file is a JSON file with the following structure:
List of lists with: “section_id”, “x”, “y”, “diff”.
List of lists because we want to store groups of cross-sections that are close to each other.
- plot_dem_with_background(figax: tuple[matplotlib.pyplot.Figure, matplotlib.pyplot.Axes] = None) tuple[matplotlib.pyplot.Figure, matplotlib.pyplot.Axes][source]
Plot the reference array with a background.
- plot_cartoweb(figax: tuple[matplotlib.pyplot.Figure, matplotlib.pyplot.Axes] = None) tuple[matplotlib.pyplot.Figure, matplotlib.pyplot.Axes][source]
Plot the reference array with a background.
- plot_background_grey(figax: tuple[matplotlib.pyplot.Figure, matplotlib.pyplot.Axes] = None) tuple[matplotlib.pyplot.Figure, matplotlib.pyplot.Axes][source]
Plot the reference array with a background.
- plot_dem(figax: tuple[matplotlib.pyplot.Figure, matplotlib.pyplot.Axes] = None, use_rebin_if_exists: bool = True) tuple[matplotlib.pyplot.Figure, matplotlib.pyplot.Axes][source]
Plot the reference array.
- plot_XY(figax: tuple[matplotlib.pyplot.Figure, matplotlib.pyplot.Axes] = None, s: float = 10, alpha: float = 0.5, colorized_diff: bool = False, default_color=('blue', 'red'), which_ones: Literal['left', 'right', 'all'] = 'all') tuple[matplotlib.pyplot.Figure, matplotlib.pyplot.Axes][source]
Plot the XY of the differences.
- Parameters:
figax – Tuple of (Figure, Axes) to plot on. If None, a new figure and axes will be created.
s – Size of the points.
alpha – Alpha of the points.
colorized_diff – If True, the points will be colored based on the difference value.
default_color – If colorized_diff is False, the points will be colored with these colors for left and right.
which_ones – Which points to plot. Can be ‘left’, ‘right’, or ‘all’.
- plot_mainpage_map() tuple[matplotlib.pyplot.Figure, matplotlib.pyplot.Axes][source]
Plot the main page map with all differences.
- _complete_report_mainpage(page: CSvsDEM_MainLayout)[source]
Complete the report with the global summary and individual differences.
- _sort_groups_by_inverse_deltaz()[source]
Sort the groups by the maximum difference in descending order.
- class wolfhece.report.compare_cs_dem.CompareCSvsDEM_wx(cross_sections: wolfhece.PyCrosssections.crosssections | pathlib.Path | str, dem: wolfhece.wolf_array.WolfArray | str | pathlib.Path, laz_directory: pathlib.Path | str = None, support: pathlib.Path | str | wolfhece.PyVertexvectors.vector = None, threshold_z: float = 0.5, distance_threshold: float = 50.0, dpi: int = 150, nb_max_groups: int = -1, **kwargs)[source]
Bases:
wolfhece.report.pdf.PDFViewer
A sized frame.
Controls added to its content pane will automatically be added to the panes sizer.