wolfhece.report.compare_arrays
Module Contents
- class wolfhece.report.compare_arrays.ArrayDifferenceLayout(title: str, filename='', ox=0, oy=0, tx=0, ty=0, parent=None, is2D=True, idx='', plotted=True, mapviewer=None, need_for_wx=False, bbox=None, find_minmax=True, shared=False, colors=None)[source]
Bases:
wolfhece.report.common.DefaultLayoutA4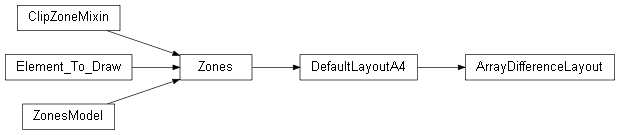
Layout for comparing two arrays in a report.
1 cadre pour la zone traitée avec photo de fond ign + contour vectoriel 1 cadre avec zoom plus large min 250m 1 cadre avec matrice ref + contour vectoriel 1 cadre avec matrice à comparer + contour vectoriel 1 cadre avec différence 1 cadre avec valeurs de synthèse
1 cadre avec histogramme 1 cadre avec histogramme des différences
- class wolfhece.report.compare_arrays.CompareArraysLayout(title: str, filename='', ox=0, oy=0, tx=0, ty=0, parent=None, is2D=True, idx='', plotted=True, mapviewer=None, need_for_wx=False, bbox=None, find_minmax=True, shared=False, colors=None)[source]
Bases:
wolfhece.report.common.DefaultLayoutA4
Global layout for A4 report.
This class inherits from Zones and defines a standard layout for A4 reports. It includes predefined areas for the title, versions, logo, and footer.
- class wolfhece.report.compare_arrays.CompareArraysLayout2(title: str, filename='', ox=0, oy=0, tx=0, ty=0, parent=None, is2D=True, idx='', plotted=True, mapviewer=None, need_for_wx=False, bbox=None, find_minmax=True, shared=False, colors=None)[source]
Bases:
wolfhece.report.common.DefaultLayoutA4
Global layout for A4 report.
This class inherits from Zones and defines a standard layout for A4 reports. It includes predefined areas for the title, versions, logo, and footer.
- class wolfhece.report.compare_arrays.ArrayDifference(reference: wolfhece.wolf_array.WolfArray, to_compare: wolfhece.wolf_array.WolfArray, index: int, label: numpy.ndarray)[source]
Class to manage the difference between two WolfArray objects.
- property external_border: wolfhece.PyVertexvectors.vector[source]
Get the bounds of the difference part.
- set_palette_distribute(minval: float, maxval: float, step: int = 0)[source]
Set the palette for both arrays.
- set_palette(values: list[float], colors: list[tuple[int, int, int]])[source]
Set the palette for both arrays based on specific values.
- plot_position(figax: tuple[matplotlib.pyplot.Figure, matplotlib.pyplot.Axes] = None) tuple[matplotlib.pyplot.Figure, matplotlib.pyplot.Axes][source]
Plot the reference array.
- plot_position_scaled(scale=4, figax: tuple[matplotlib.pyplot.Figure, matplotlib.pyplot.Axes] = None) tuple[matplotlib.pyplot.Figure, matplotlib.pyplot.Axes][source]
Plot the reference array.
- plot_reference(figax: tuple[matplotlib.pyplot.Figure, matplotlib.pyplot.Axes] = None) tuple[matplotlib.pyplot.Figure, matplotlib.pyplot.Axes][source]
Plot the reference array.
- plot_to_compare(figax: tuple[matplotlib.pyplot.Figure, matplotlib.pyplot.Axes] = None) tuple[matplotlib.pyplot.Figure, matplotlib.pyplot.Axes][source]
Plot the array to compare.
- property difference: wolfhece.wolf_array.WolfArray[source]
Get the difference between the two arrays.
- plot_difference(figax: tuple[matplotlib.pyplot.Figure, matplotlib.pyplot.Axes] = None) tuple[matplotlib.pyplot.Figure, matplotlib.pyplot.Axes][source]
Plot the array to compare.
- _plot_histogram_reference(figax: tuple[matplotlib.pyplot.Figure, matplotlib.pyplot.Axes] = None, density=True, alpha=0.5, **kwargs) tuple[matplotlib.pyplot.Figure, matplotlib.pyplot.Axes][source]
Plot histogram of the reference array.
- _plot_histogram_to_compare(figax: tuple[matplotlib.pyplot.Figure, matplotlib.pyplot.Axes] = None, density=True, alpha=0.5, **kwargs) tuple[matplotlib.pyplot.Figure, matplotlib.pyplot.Axes][source]
Plot histogram of the array to compare.
- plot_histograms(figax: tuple[matplotlib.pyplot.Figure, matplotlib.pyplot.Axes] = None, density=True, alpha=0.5, **kwargs) tuple[matplotlib.pyplot.Figure, matplotlib.pyplot.Axes][source]
Plot histograms of both arrays.
- plot_histograms_difference(figax: tuple[matplotlib.pyplot.Figure, matplotlib.pyplot.Axes] = None, density=True, alpha=1.0, **kwargs) tuple[matplotlib.pyplot.Figure, matplotlib.pyplot.Axes][source]
Plot histogram of the difference between the two arrays.
- _complete_report(page: ArrayDifferenceLayout)[source]
Complete the report with the arrays and histograms.
- class wolfhece.report.compare_arrays.CompareArrays(reference: wolfhece.wolf_array.WolfArray | str | pathlib.Path, to_compare: wolfhece.wolf_array.WolfArray | str | pathlib.Path)[source]
-
- difference_parts: dict[int, ArrayDifference][source]
- plot_position(figax: tuple[matplotlib.pyplot.Figure, matplotlib.pyplot.Axes] = None) tuple[matplotlib.pyplot.Figure, matplotlib.pyplot.Axes][source]
Plot the reference array with a background.
- plot_cartoweb(figax: tuple[matplotlib.pyplot.Figure, matplotlib.pyplot.Axes] = None) tuple[matplotlib.pyplot.Figure, matplotlib.pyplot.Axes][source]
Plot the reference array with a background.
- plot_topo_grey(figax: tuple[matplotlib.pyplot.Figure, matplotlib.pyplot.Axes] = None) tuple[matplotlib.pyplot.Figure, matplotlib.pyplot.Axes][source]
Plot the reference array with a background.
- plot_reference(figax: tuple[matplotlib.pyplot.Figure, matplotlib.pyplot.Axes] = None) tuple[matplotlib.pyplot.Figure, matplotlib.pyplot.Axes][source]
Plot the reference array.
- plot_to_compare(figax: tuple[matplotlib.pyplot.Figure, matplotlib.pyplot.Axes] = None) tuple[matplotlib.pyplot.Figure, matplotlib.pyplot.Axes][source]
Plot the array to compare.
- plot_difference(figax: tuple[matplotlib.pyplot.Figure, matplotlib.pyplot.Axes] = None) tuple[matplotlib.pyplot.Figure, matplotlib.pyplot.Axes][source]
Plot the difference between the two arrays.
- localize_differences(threshold: float = 0.0, ignored_patche_area: float = 1.0) numpy.ndarray[source]
Localize the differences between the two arrays and label them.
- Parameters:
threshold – The threshold value to consider a difference significant.
ignored_patche_area – The area of patches to ignore (in m²).
- _complete_report(page: CompareArraysLayout)[source]
Complete the report with the global summary and individual differences.
- plot_histogram_features(figax: tuple[matplotlib.pyplot.Figure, matplotlib.pyplot.Axes] = None, density=True, alpha=0.5, **kwargs) tuple[matplotlib.pyplot.Figure, matplotlib.pyplot.Axes][source]
Plot histogram of the number of cells in each feature.
- plot_histogram_features_difference(figax: tuple[matplotlib.pyplot.Figure, matplotlib.pyplot.Axes] = None, density=True, alpha=1.0, **kwargs) tuple[matplotlib.pyplot.Figure, matplotlib.pyplot.Axes][source]
Plot histogram of the volume in each feature for the difference.
- _complete_report2(page: CompareArraysLayout)[source]
Complete the report with the individual differences.
- class wolfhece.report.compare_arrays.CompareArrays_wx(reference: wolfhece.wolf_array.WolfArray | str | pathlib.Path, to_compare: wolfhece.wolf_array.WolfArray | str | pathlib.Path, ignored_patche_area: float = 2.0, nb_max_patches: int = 10, threshold: float = 0.01, dpi=200, **kwargs)[source]
Bases:
wolfhece.report.pdf.PDFViewer
A sized frame.
Controls added to its content pane will automatically be added to the panes sizer.
- class wolfhece.report.compare_arrays.CompareArrays_by_vector(reference: wolfhece.wolf_array.WolfArray | str | pathlib.Path, to_compare: wolfhece.wolf_array.WolfArray | str | pathlib.Path, vector_to_analyze: wolfhece.PyVertexvectors.vector)[source]
-
- update_ref(new_reference: wolfhece.wolf_array.WolfArray | str | pathlib.Path)[source]
Update the reference array and recalculate the difference.
- class wolfhece.report.compare_arrays.CompareArrays_by_zones(reference: wolfhece.wolf_array.WolfArray | str | pathlib.Path, to_compare: wolfhece.wolf_array.WolfArray | str | pathlib.Path, zones_to_analyze: wolfhece.PyVertexvectors.Zones)[source]
-
- update_ref(new_reference: wolfhece.wolf_array.WolfArray | str | pathlib.Path)[source]
Update the reference array and recalculate the difference.
- update_to_compare(new_to_compare: wolfhece.wolf_array.WolfArray | str | pathlib.Path)[source]
Update the array to compare and recalculate the difference.