Zones, zone, vector, vertex, What is it ?
Note — This tutorial uses GUI classes (
vector,zone,Zones). For headless or script usage, equivalent model classes are available:vectorModel,zoneModel,ZonesModel. See the Model/GUI architecture tutorial for details.
Basics
In addition to the matrix information WolfArray, it is necessary to have a way to work with vector data. This is the purpose of the classes Zones, zone, vector, and wolfvertex.
It is the combination of these classes that provides a coherent set, even though the classes can be used individually in specific scripts.
The most fundamental information is wolfvertex, which contains 2D or 3D coordinates in the attributes x, y, and z.
wolfvertex instances are then assembled to form line segments and, by extension, polylines and polygons. Unlike the Fortran code, which has a segment class, in Python, vertices are stored in the myvertices attribute of the vector class.
To create a polygon, it is not mandatory to have a duplicated vertex. The closed attribute indicates whether the vector should be considered closed or not. If the last vertex is not identical to the first, the vector will behave like a polyline.
A zone is a class used to organize multiple vectors. These are stored in the myvectors attribute.
A Zones is a class used to organize multiple instances of zone, in the myzones attribute.
Unlike a shapefile, the storage mode proposed here does not force the use of only one type of data. It is therefore possible to combine polylines and polygons in the same object.
Formats
The default writing format is .vec, which is a text file containing only the X and Y coordinates.
It is also possible to write a .vecz file that includes the Z coordinate.
The .vec and .vecz formats are compatible with the Fortran code and the historical WOLF interface written in VisualBasic6. In Python, it is also possible to write the information in JSON format.
An internal import/export filter for the .shp, .gpkg, and .gdb formats is provided through Geopandas.
An internal import filter for .dxf is also available thanks to the ezdxf package.
Interaction with Shapely
Shapely is a powerful and widely used 2D geometry library (GEOS, PostGIS…).
It is used internally by the vector class for certain operations. For example, it is possible to obtain a LineString via .linestring or a Polygon via .polygon.
For efficiency reasons, Wolf routines can prepare Shapely geometries to take advantage of the associated computational acceleration.
[1]:
from wolfhece.PyVertexvectors import Zones, zone, vector, wolfvertex
To load a Zones object from a file, use Zones(filename), with filename a string path to the file to be loaded. This file can have the extension .vec, .vecz, .shp, or .dxf. If you want to create a Zones object from scratch, follow the instructions below.
Create a wolfvertex
[2]:
pt1 = wolfvertex(10., 20.) # Z coordinate is not mandatory
pt2 = wolfvertex(30., 40.)

print(pt1.z) # Z coordinate is -99999. by default
-99999.0
[3]:
# List all attributes/routines of the class wolfvertex - remove the __ methods and the _ methods
print([attr for attr in dir(pt1) if not attr.startswith('__') and not attr.startswith('_')])
['add_value', 'add_values', 'addvalue', 'as_shapelypoint', 'copy', 'dist2D', 'dist3D', 'get_value', 'get_values', 'getcoords', 'getvalue', 'in_use', 'is_like', 'limit2bounds', 'rotate', 'values', 'x', 'y', 'z']
A wolfvertex can store associated values in addition to its coordinates.
To achieve this, you can use the addvalue and getvalue methods.
[4]:
pt1.addvalue('added_value', 1.)
pt1.addvalue('string', 'for the test')

print(pt1.getvalue('added_value')) # 1.0
print(pt1.getvalue('string')) # for the test
1.0
for the test
We can retrieve a numpy vector with coordinates by getcoords.
[5]:
pt1.getcoords()
[5]:
array([ 1.0000e+01, 2.0000e+01, -9.9999e+04])
We can test 2 wolfvertex by is_like (test only x,y,z)
[6]:
print(pt2.is_like(pt1)) # True if the two vertices are in the same zone

pt3 = pt1.copy() # Copy the vertex
print(pt3.is_like(pt1)) # True if the two vertices are in the same zone
False
True
Create a vector
A vector is a list of wolfvertex instances…
[7]:
import numpy as np

x = np.linspace(0, 10, 100)
y = np.sin(x)

vert = [wolfvertex(x[i], y[i]) for i in range(len(x))]

vect = vector(name = 'test')
vect.add_vertex(vert)

print(vect)
print(vect.nbvertices) # 100

print(vect.xmin, vect.xmax) # -99999.0 -99999.0
print(vect.ymin, vect.ymax) # -99999.0 -99999.0

# By default, the vector does not set the min/max values of the vertices. We need to set them manually.
# This is done by the find_minmax() method.
vect.find_minmax()
print(vect.xmin, vect.xmax) # 0.0 10.0
print(vect.ymin, vect.ymax) # -0.9993845576124357 0.9996923408861117
test
100
-99999.0 -99999.0
-99999.0 -99999.0
0.0 10.0
-0.9993845576124357 0.9996923408861117
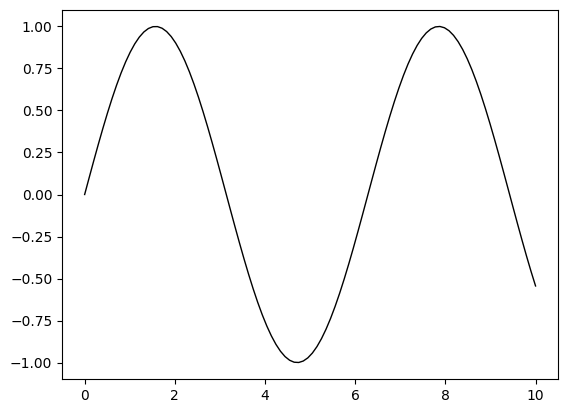
Plot a vector
We can plot a vector in a Matplotlib Axis.
[8]:
import matplotlib.pyplot as plt

fig, ax = plt.subplots()
vect.plot_matplotlib(ax)
[8]:
(<Figure size 640x480 with 1 Axes>, <Axes: >)
Create a zone
A zone is a list of vector instances
[9]:
x = np.linspace(0, 10, 100)
y = np.cos(x)

# We can also create a vector from a numpy array.
# The array must be 2D with the first column being the x coordinates and the second column being the y coordinates. shape (n, 2) or (n, 3) if z is present.
# We can also use the add_vertices_from_array() method to add vertices from a numpy array.
vect2 = vector(name = 'test2', fromnumpy=np.vstack((x, y)).T) # Create a vector from a numpy array
vect2.find_minmax()

print(vect2.xmin, vect2.xmax) # 0.0 10.0
print(vect2.ymin, vect2.ymax) # -0.9999471661761239 1.0

z1 = zone(name = 'zone1') # Create a zone from the vector
z1.add_vector(vect, forceparent=True) # Add the vector to the zone
z1.add_vector(vect2, forceparent=True) # Add the vector to the zone

# The forceparent argument is used to force the zone to be the parent of the vector.
# So, if a vector want to use the zone instance, it can do it with its `parentzone` attribute.

assert vect.parentzone == z1 # The vector is in the zone
assert vect2.parentzone == z1 # The vector is in the zone

# Regarding the extent of the zone, we can set it manually or let the zone calculate it from the vectors.
z1.find_minmax() # Calculate the min/max values of the zone from the vectors
print(z1.xmin, z1.xmax) # 0.0 10.0
print(z1.ymin, z1.ymax) # -0.9999471661761239 1.0
0.0 10.0
-0.9999471661761239 1.0
0.0 10.0
-0.9999471661761239 1.0
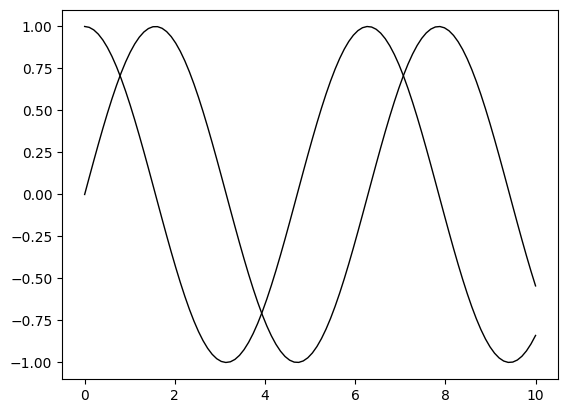
Plot a zone
[10]:
fig, ax = plt.subplots()
z1.plot_matplotlib(ax) # Plot the zone with the vectors
[10]:
(<Figure size 640x480 with 1 Axes>, <Axes: >)
Create a Zones
A Zones instance is a list of zone instances
[11]:
z2 = zone(name = 'zone2') # Create a zone from the vector

vect3 = vect.move(2., 1., inplace=False) # Move a copy of the vector to a new position
vect4 = vect2.move(0.5, 0.5, inplace=False) # Move a copy of the vector to a new position

z2.add_vector(vect3, forceparent=True) # Add the vector to the zone
z2.add_vector(vect4, forceparent=True) # Add the vector to the zone
z2.find_minmax() # Calculate the min/max values of the zone from the vectors

zones = Zones()
zones.add_zone(z1, forceparent=True) # Add the zone to the list of zones
zones.add_zone(z2, forceparent=True) # Add the zone to the list of zones
zones.find_minmax() # Calculate the min/max values of the zones from the vectors

print(zones.xmin, zones.xmax) # 0.0 10.0
print(zones.ymin, zones.ymax) # -0.9999471661761239 1.0
0.0 12.0
-0.9999471661761239 1.9996923408861118
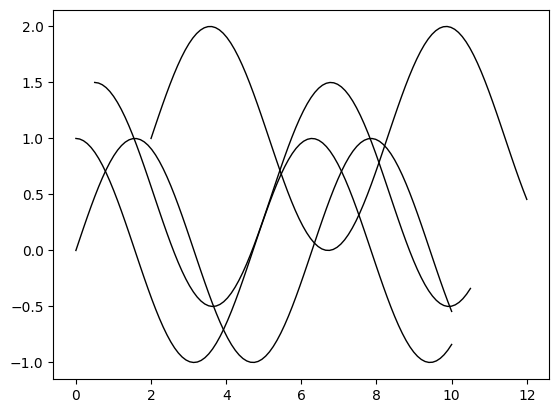
Plot a Zones
[12]:
fig, ax = plt.subplots()
zones.plot_matplotlib(ax) # Plot the zone with the vectors
plt.show() # Show the plot
Save a Zones to file
[13]:
# zones.saveas('test.vec')  # Save the zones in a .vec file
# zones.saveas('test.vecz') # Save the zones in a .vecz file (Z values included)
# zones.saveas('test.shp')  # Save the zones in a .shp file (Shapefile format)
Closed Vectors (Polygons vs. Polylines)
The closed property controls whether a vector is treated as a closed polygon or an open polyline.
Setting closed = True does not duplicate the first vertex — it simply tells downstream routines to close the shape logically.
[14]:
square = vector(name='square')
square.add_vertices_from_array(np.array([[0, 0], [1, 0], [1, 1], [0, 1]]))

print("Closed?", square.closed)  # False — no duplicate last vertex
square.closed = True
print("Closed?", square.closed)  # True
Closed? False
Closed? True
Shapely Interoperability
Every vector exposes Shapely geometry properties:
.linestring—shapely.geometry.LineString.polygon—shapely.geometry.Polygon(only meaningful for closed vectors)
You can also use explicit conversion methods: asshapely_ls(), asshapely_pol(), asshapely_mp().
[15]:
ls = vect.linestring          # Shapely LineString from the sine-wave vector
print(type(ls), f"length = {ls.length:.4f}")

pol = square.polygon          # Shapely Polygon from the closed square
print(type(pol), f"area = {pol.area:.4f}")

mp = square.asshapely_mp()    # Shapely MultiPoint
print(type(mp), f"num points = {len(mp.geoms)}")
<class 'shapely.geometry.linestring.LineString'> length = 12.2510
<class 'shapely.geometry.polygon.Polygon'> area = 1.0000
<class 'shapely.geometry.multipoint.MultiPoint'> num points = 4
Save / Load Round-Trip
Zones.saveas() writes to .vec, .vecz, or .shp. Reloading is done with Zones(filename).
[16]:
import tempfile, os

tmpdir = tempfile.mkdtemp()
fpath = os.path.join(tmpdir, 'roundtrip.vecz')

zones.saveas(fpath)
print("Saved to", fpath)

# Reload
zones_loaded = Zones(fpath)
print(f"Reloaded zones: {len(zones_loaded.myzones)} zone(s)")
for z in zones_loaded.myzones:
    print(f"  zone '{z.myname}': {len(z.myvectors)} vector(s)")

# Clean up
import shutil
shutil.rmtree(tmpdir)
INFO:root:Finding min and max values
Saved to C:\Users\pierre\AppData\Local\Temp\tmpz6_1bk9z\roundtrip.vecz
Reloaded zones: 2 zone(s)
  zone 'zone1': 2 vector(s)
  zone 'zone2': 2 vector(s)