wolfhece.wolf_array._mb
WolfArrayMB - GUI-enabled multi-block array class with OpenGL rendering and wxPython integration.
Inherits all data operations from WolfArrayMBModel and adds:
OpenGL rendering, palette/colormap management
Interactive wx dialogs
Matplotlib visualization (
imshow,plot_matplotlib)
Author: HECE - University of Liege, Pierre Archambeau Date: 2024
Copyright (c) 2024 University of Liege. All rights reserved.
This script and its content are protected by copyright law. Unauthorized copying or distribution of this file, via any medium, is strictly prohibited.
Module Contents
- class wolfhece.wolf_array._mb.WolfArrayMB(fname=None, mold=None, masknull=True, crop=None, whichtype=WOLF_ARRAY_MB_SINGLE, preload=True, create=False, mapviewer=None, nullvalue=0.0, srcheader=None, idx: str = '')[source]
Bases:
wolfhece.wolf_array._mb_model.WolfArrayMBModel,wolfhece.wolf_array._base_gui.WolfArray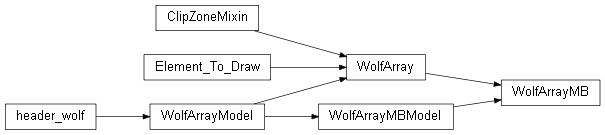
GUI-enabled multi-block array class.
Inherits data operations from
WolfArrayMBModeland GUI/rendering fromWolfArray.Blocks (
WolfArrayinstances) are stored in themyblocksdictionary, keyed by identifiers produced bygetkeyblock().- Variables:
myblocks – Dictionary mapping block keys to
WolfArrayinstances.
- myblocks: dict[str, wolfhece.wolf_array._base_gui.WolfArray][source]
- classmethod make_multiblocks(others: list, abs: bool = True, copy: bool = True) WolfArrayMB[source]
Merge several single-block arrays into a new GUI multi-block array.
- Parameters:
others – List of
WolfArrayinstances to merge.abs – If
True, use global (absolute) world coordinates.copy – If
True, copy data from each source array.
- Returns:
A new
WolfArrayMBcontaining all blocks.
- add_block(arr: wolfhece.wolf_array._base_gui.WolfArray, force_idx: bool = False, copyarray=False)[source]
Add a block to this multi-block array.
After adding all blocks, call
set_header_from_added_blocks()to recompute the global header.- Parameters:
arr – The block to add.
force_idx – If
True, the block key is assigned automatically.copyarray – If
True, a deep copy of arr is stored.
- extract_selection()[source]
Extract the current selection into a new multi-block array.
Each block’s
SelectionDataproduces a sub-array; the results are assembled into a newWolfArrayMB. If a map viewer is attached, the extracted array is also registered in it.
- contour(levels: int | list[float] = 10) wolfhece.PyVertexvectors.Zones[source]
Compute contour lines from this multi-block array.
The array is first converted to a single-block
WolfArraybefore contouring.- Parameters:
levels – Number of levels or explicit list of level values.
- Returns:
A
Zonesobject containing the contour polylines.
- allocate_ressources()[source]
Allocate memory for every block defined in
head_blocks.Creates
WolfArray(GUI-enabled) instances for each block header.
- _make_result_array()[source]
Create an empty result array of the same type (GUI-enabled).
- Returns:
A new
WolfArrayMBwith the same header.
- as_WolfArray(abs: bool = True, forced_header: wolfhece.wolf_array._header_wolf.header_wolf = None) wolfhece.wolf_array._base_gui.WolfArray[source]
Convert to a single-block GUI-enabled
WolfArray.When blocks have different resolutions, coarser blocks are rebinned to match the finest resolution.
- Parameters:
abs – If
True, use absolute coordinates.forced_header – If provided, override the target header.
- Returns:
A new single-block
WolfArray.
- read_data()[source]
Read binary block data from
filename.Creates
WolfArray(GUI-enabled) instances for each block.
- change_gui(newparentgui)[source]
Re-parent this array to a different
WolfMapViewer.If no viewer was previously attached, creates a new
Ops_Arraypanel. Otherwise, migrates the existing one.- Parameters:
newparentgui – Target
WolfMapViewerinstance.- Raises:
AssertionError – If newparentgui is not a
WolfMapViewer.
- check_plot()[source]
Mark the array for plotting and load data if needed.
Reads binary data from disk, applies the null-value mask, initialises the RGB buffer and updates the palette.
- uncheck_plot(unload: bool = True, forceresetOGL: bool = False, askquestion: bool = True)[source]
Uncheck (hide) the array and optionally unload data.
Optionally resets OpenGL display lists and frees block data.
- Parameters:
unload – If
True, unload block data from memory.forceresetOGL – If
True, force-reset OpenGL lists without asking.askquestion – If
True, prompt the user before resetting OpenGL lists.
Share this array’s palette with all linked arrays.
- updatepalette(which: int = 0, onzoom: list[float] = [])[source]
Update the palette/colormap across all blocks.
When
mypal.automaticisTrue, the palette range is recomputed from the data (optionally restricted to onzoom).- Parameters:
which – Colormap index to use.
onzoom – If not empty,
[xmin, xmax, ymin, ymax]bounds restricting the data used for palette computation.
- plot(sx=None, sy=None, xmin=None, ymin=None, xmax=None, ymax=None, size=None)[source]
Render all blocks via OpenGL.
Also draws the current selection and any attached zones.
- Parameters:
sx – X scale factor.
sy – Y scale factor.
xmin – Viewport X minimum.
ymin – Viewport Y minimum.
xmax – Viewport X maximum.
ymax – Viewport Y maximum.
size – Unused, kept for API compatibility.
- _fill_ogllist_for_one_grid_cell(curscale, loci, locj, force=False)[source]
Fill OpenGL display list for a single grid cell in every block.
- imshow(figax: tuple[matplotlib.figure.Figure, matplotlib.axis.Axis] = None, cmap: matplotlib.colors.Colormap = None, step_ticks=100.0) tuple[matplotlib.figure.Figure, matplotlib.axis.Axis][source]
Create a Matplotlib image from this multi-block array.
Assembles all blocks into a single raster at the finest resolution, applies the palette (or a Matplotlib colormap), and renders with
imshow.- Parameters:
figax –
(fig, ax)to plot into. IfNone, a new figure is created.cmap – Matplotlib
Colormap. IfNone, the WOLF palette’s RGBA output is used.step_ticks – Spacing between axis tick labels in world coordinate units.
- Returns:
(fig, ax)tuple.
- plot_matplotlib(figax: tuple = None, getdata_im: bool = False, update_palette: bool = True, vmin: float = None, vmax: float = None, figsize: tuple = None, Walonmap: bool = False, cat: str = 'IMAGERIE/ORTHO_2022_ETE', first_mask_data: bool = True, with_legend: bool = False)[source]
Plot the multi-block array using Matplotlib.
Converts to a single-block
WolfArrayand delegates to itsplot_matplotlib()method.Notes
The null-value mask is applied before plotting.
If Walonmap is
True, a background map from the WalOnMap service is overlaid.The aspect ratio is set to
'equal'.
- Parameters:
figax –
(fig, ax)tuple. IfNone, a new figure is created.getdata_im – If
True, also return the image object.update_palette – If
True, update the palette before plotting.vmin – Minimum value for colour scaling.
vmax – Maximum value for colour scaling.
figsize – Figure size in inches
(width, height).Walonmap – If
True, overlay an orthophoto from WalOnMap.cat – WalOnMap orthophoto category (e.g.
'IMAGERIE/ORTHO_2022_ETE').first_mask_data – If
True, apply the mask before plotting.with_legend – If
True, add a colour legend.
- Returns:
(fig, ax)or(fig, ax, im)if getdata_im isTrue.- Return type:
tuple