RapidReport — Quick Word reports from Python
RapidReport creates Word documents (.docx) with a simple API. Ideal for generating reports from Jupyter notebooks or automated scripts.
Features:
Title page (title, author, date, document hash)
Automatic table of contents
Titles, paragraphs (with bold and italic)
Figures with automatic numbering and captions
Bullet lists
Tables
[1]:
from wolfhece.report.reporting import RapidReport
from pathlib import Path
import tempfile
Creating a report
[2]:
rapport = RapidReport('Flood Analysis Report', 'Pierre Archambeau')
Adding content
[3]:
# Title (level 0 = main, 1 = sub, etc.)
rapport.add_title('Introduction', level=0)

# Paragraph with markdown-style formatting
rapport.add_paragraph(
    'This report presents the results of the **flood simulation** '
    'for the *Vesdre* catchment using WOLF2D GPU.'
)

# Using += operator for quick text addition
rapport += 'Additional notes can be added this way.\nWith line breaks.'
[4]:
# Bullet list
rapport.add_title('Key findings', level=1)
rapport.add_bullet_list([
    'Maximum water depth: 3.2 m',
    'Peak discharge: 450 m³/s',
    'Flood duration: 12 hours',
    'Affected buildings: 127',
])
[5]:
# Table from list of lists (first row = header)
rapport.add_title('Simulation parameters', level=1)
rapport.add_table_from_listoflists([
    ['Parameter', 'Value', 'Unit'],
    ['Grid resolution', '1.0', 'm'],
    ['Manning coefficient', '0.035', 's/m^(1/3)'],
    ['Time step', '0.5', 's'],
    ['Simulation duration', '86400', 's'],
])
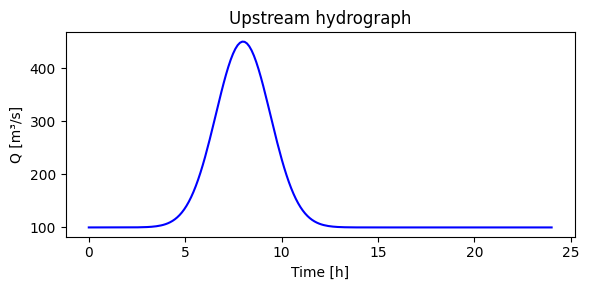
[6]:
# Figure with caption (auto-numbered)
# Here we create a sample matplotlib figure and save it
import matplotlib.pyplot as plt
import numpy as np

tmpdir = Path(tempfile.mkdtemp())
fig_path = tmpdir / 'hydrograph.png'

t = np.linspace(0, 24, 200)
q = 100 + 350 * np.exp(-((t - 8)**2) / 4)

fig, ax = plt.subplots(figsize=(6, 3))
ax.plot(t, q, 'b-')
ax.set_xlabel('Time [h]'); ax.set_ylabel('Q [m³/s]')
ax.set_title('Upstream hydrograph')
plt.tight_layout()
fig.savefig(fig_path, dpi=150)
plt.show()

# Add to report
rapport.add_figure(str(fig_path), 'Upstream hydrograph at the inlet boundary.')
Saving the report
[7]:
output_path = tmpdir / 'flood_report.docx'
rapport.save(str(output_path))
print(f"Report saved to {output_path}")
Report saved to C:\Users\pierre\AppData\Local\Temp\tmpl26cxg8t\flood_report.docx
Customizing fonts
[8]:
# Change default font (applied to new content)
rapport2 = RapidReport('Custom Font Report', 'Alice')
rapport2.set_font(fontname='Calibri', fontsize=11)
rapport2.add_title('Test', level=0)
rapport2.add_paragraph('This uses Calibri 11pt.')
rapport2.save(str(tmpdir / 'custom_font.docx'))
print('Done')
Done
Summary
Method |
Purpose |
|---|---|
|
Create a new report |
|
Section heading |
|
Body text (supports |
|
Quick paragraph addition |
|
Auto-numbered figure |
|
Bullet list |
|
Table (first row = header) |
|
Customize typography |
|
Export as |