Download data as anonymous user
from https://hydrometrie.wallonie.be/ calling Kisters webservices
@author : Pierre Archambeau - 2024
Load modules
[1]:
from datetime import datetime as dt
import matplotlib.pyplot as plt
import pandas as pd

from wolfhece.hydrometry import kiwis
from wolfhece.hydrometry.kiwis import hydrometry, station_fields as sf, timeseries_fields as ts
Create anonymous access to SPW web services
[2]:
db = hydrometry()
WARNING:root:No directory to save structure
Print available columns in stations
[3]:
print(db)
Columns in stations :
site_no
station_no
station_name
station_id
station_local_x
station_local_y
station_latitude
station_longitude
river_name
station_gauge_datum
CATCHMENT_SIZE
BV_DCE
Get all stations with flow rate measurements
“Official” groups
Available fields :
station_name == name used on hydrometrie.wallonie.be
station_no == code identified on hydrometrie.wallonie.be
station_id == internal index
ts_id == id of the timeserie
ts_name == name of the timeserie
parametertype_id
parametertype_id
Return :
pandas dataframe
[4]:
stations = db.get_timeseries_group('flowrate','1h')
print(stations.columns)
Index(['station_name', 'station_no', 'station_id', 'ts_id', 'ts_name',
       'parametertype_id', 'parametertype_name'],
      dtype='object')
Get all stations with rain measurements
[ ]:
pluvios = db.get_timeseries_group('rain', '1h')
print(pluvios['station_name'])
0                WAVRE
1     LOUVAIN LA NEUVE
2              BOUSVAL
3               PERWEZ
4             HELECINE
            ...
88               ORVAL
89       STEFFESHAUSEN
90          SANKT-VITH
91            BASTOGNE
92          MARTELANGE
Name: station_name, Length: 93, dtype: object
Get ts_id for a specific station
[5]:
amay_byname = stations[stations[sf.STATION_NAME.value]=='AMAY']
amay_byid = stations[stations[sf.STATION_ID.value]=='7132']

tsid = int(amay_byname[ts.TS_ID.value].values[0])

print(tsid)
245548010
Get time serie between 2 dates
Info : maximum download = 250.000 values The routine will split the interval if necessary.
Return :
pandas timeserie
[6]:
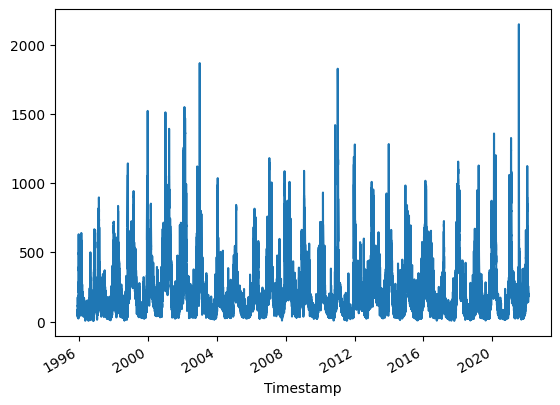
ts = db.timeseries(fromdate=dt(1960,1,1), todate=dt(2022,2,1), ts_id = tsid)
1960-01-01 00:00:00 1982-10-25 08:00:00
1982-10-25 08:00:00 2005-08-18 16:00:00
2005-08-18 16:00:00 2022-02-01 00:00:00
[7]:
ts.plot()
[7]:
<AxesSubplot: xlabel='Timestamp'>
Exploring the database more deeply
[8]:
#Get all time series available for a specific station
id,df = db.timeseries_list(stationcode='7132')
# id,df = db.timeseries_list(stationname='AMAY')

#Select only flow rate "Q"  (other possibilities : "H" or "v")
flowrate_ts = df[df['parametertype_name']=='Q']['ts_name']
flowrate_ts[flowrate_ts.str.contains('Complet')]
[8]:
14    05a-Debit ultrason.Complet.Alarmes
17             05-Debit ultrason.Complet
Name: ts_name, dtype: object
Get data
[9]:
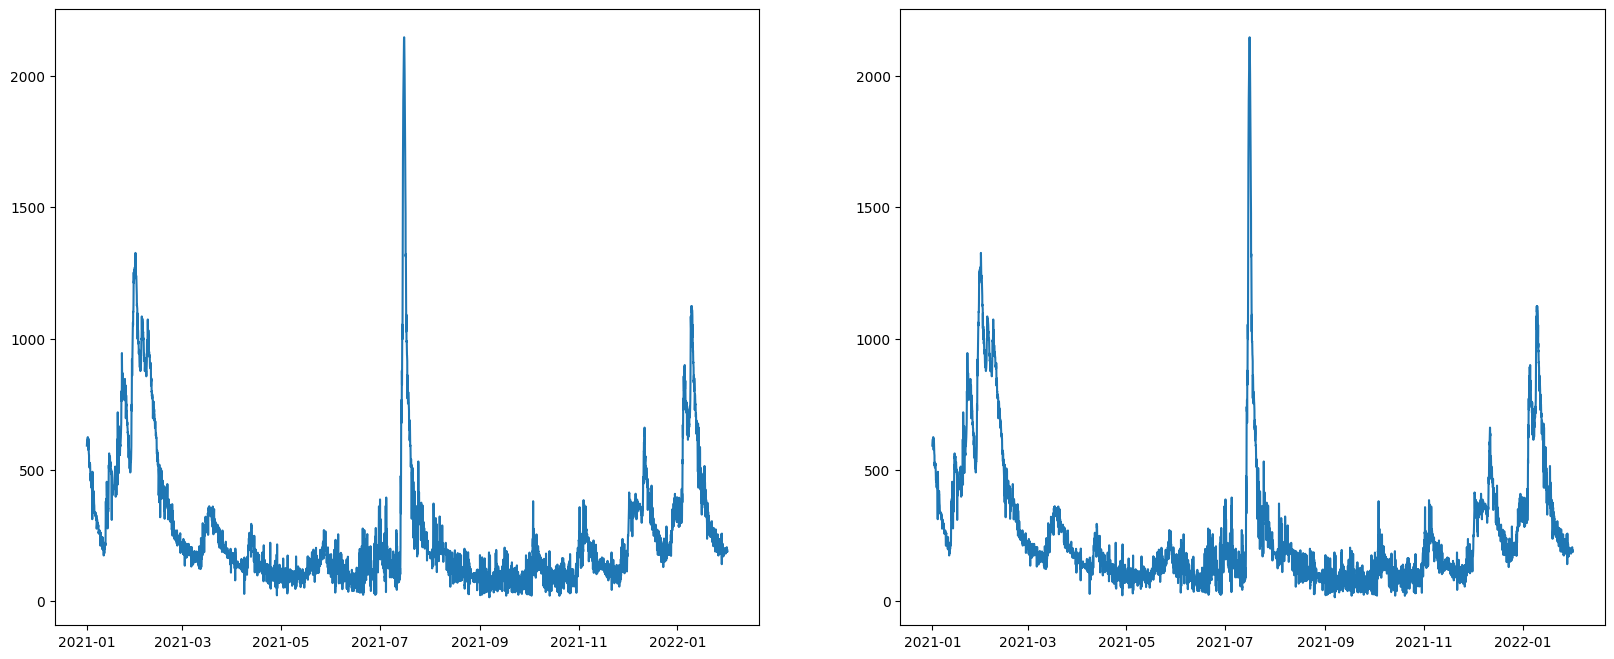
fromdate=dt(2021,1,1)
todate=dt(2022,2,1)
ts = db.timeseries(stationname='AMAY', fromdate=fromdate, todate=todate, ts_name='05-Debit ultrason.Complet')
ts_off = db.timeseries(fromdate=fromdate, todate=todate, ts_id = tsid)
[10]:
fig, ax = plt.subplots(1,2)
fig.set_size_inches(20,8)
ax[0].plot(ts)
ax[1].plot(ts_off)
[10]:
[<matplotlib.lines.Line2D at 0x2253606d120>]