wolfhece.pyvertexvectors._triangulation
Triangulation GUI class with OpenGL and matplotlib rendering.
Module Contents
- class wolfhece.pyvertexvectors._triangulation.Triangulation(fn='', pts=None, tri=None, idx: str = '', plotted: bool = True, mapviewer=None, need_for_wx: bool = False)[source]
Bases:
wolfhece.pyvertexvectors._models.TriangulationModel,wolfhece.drawing_obj.Element_To_Draw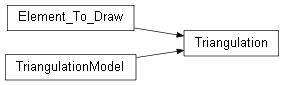
Triangulation with OpenGL rendering and matplotlib plotting.
Inherits all data operations from
TriangulationModeland addsElement_To_Drawintegration, OpenGL display-list rendering, and matplotlib visualisation helpers.- _make_triangulation(**kwargs) Triangulation[source]
Factory: create a GUI-enabled triangulation.
- read(fn: str)[source]
Read a file, then reset the GL display list.
- Parameters:
fn – File path to read.
- import_from_gltf(fn='')[source]
Import a GLTF/GLB file, with optional wx file dialog.
- Parameters:
fn – File path (empty to show a file dialog).
- export_to_gltf(fn='')[source]
Export to GLTF/GLB, with optional wx file dialog.
- Parameters:
fn – File path (empty to show a file dialog).
- copy() Triangulation[source]
Return a GUI-enabled copy of the triangulation.
- plot(sx=None, sy=None, xmin=None, ymin=None, xmax=None, ymax=None, size=None)[source]
Plot the triangulation using OpenGL.
- Parameters:
sx – Scale factor along X.
sy – Scale factor along Y.
xmin – Minimum X of the viewport.
ymin – Minimum Y of the viewport.
xmax – Maximum X of the viewport.
ymax – Maximum Y of the viewport.
size – Reference size for rendering.
- plot_matplotlib(ax: matplotlib.axes.Axes | tuple[matplotlib.figure.Figure, matplotlib.axes.Axes] = None, color='black', alpha=1.0, lw=1.5, **kwargs)[source]
Plot the triangulation using Matplotlib.
- Parameters:
ax – Axes, (Figure, Axes) tuple, or None to create a new figure.
color – Line colour.
alpha – Opacity (0–1).
lw – Line width.
kwargs – Extra keyword arguments forwarded to
ax.plot.
- Returns:
(fig, ax)tuple.
- property mpl_triangulation: matplotlib.tri.Triangulation[source]
Return the triangulation as a Matplotlib Triangulation object.
- Returns:
matplotlib.tri.Triangulationor None if empty.
- plot_matplotlib_3D(ax: matplotlib.axes.Axes | tuple[matplotlib.figure.Figure, matplotlib.axes.Axes] = None, color='black', alpha=0.2, lw=1.5, edgecolor='k', shade=True, **kwargs)[source]
Plot the triangulation as a 3-D surface using Matplotlib.
- Parameters:
ax – 3-D Axes, (Figure, Axes) tuple, or None to create one.
color – Surface colour.
alpha – Surface opacity.
lw – Line width of triangle edges.
edgecolor – Edge colour.
shade – Whether to shade the surface.
kwargs – Extra keyword arguments forwarded to
plot_trisurf.
- Returns:
(fig, ax)tuple, or(None, None)if empty.